EK.

Research Visualisations

A gallery of some of my favourite data visualisations.
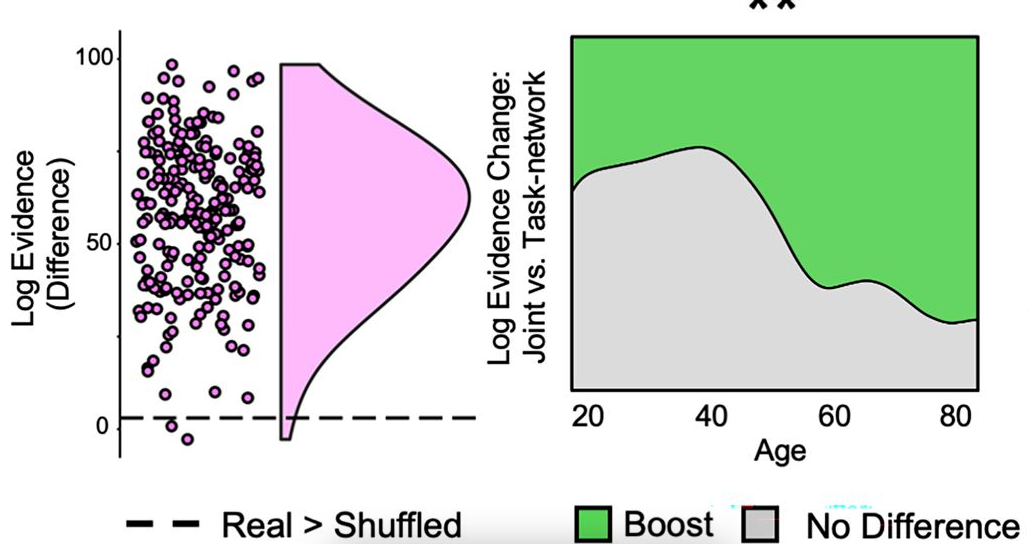
Visualisation 1

Neural Diversity

Mapping brain activity patterns across demographics.

Visualisation 2

Stroke Recovery

Longitudinal analysis of reaching neglect compensation.
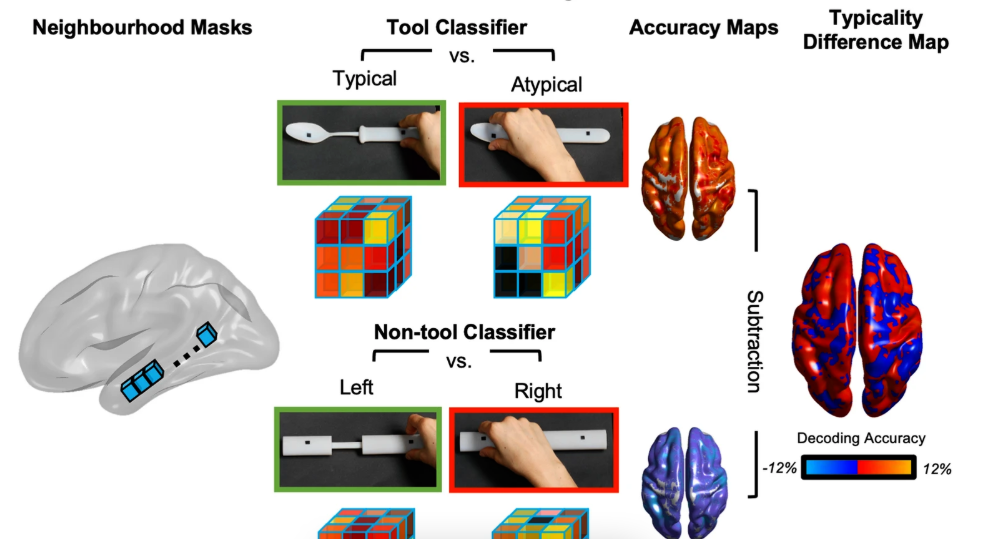
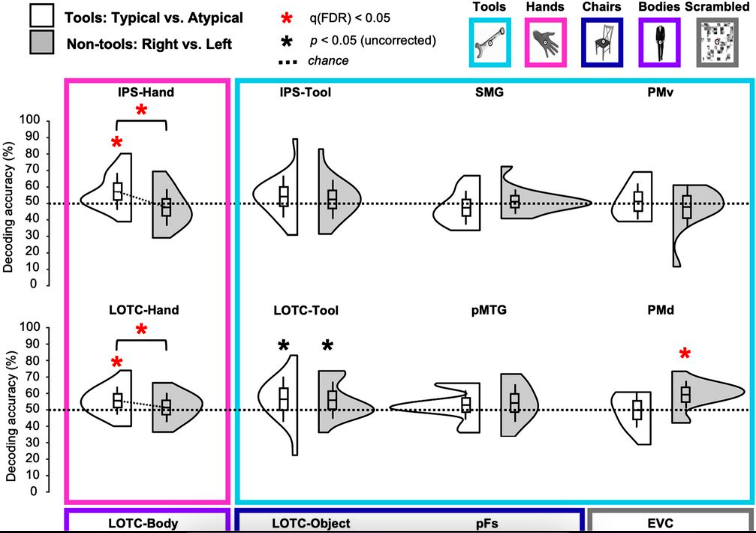
Visualisation 3

Action Translation

How the temporal cortex processes tool-use actions.

× Enlarged visualization
Archive

Archive

2026

The Tech Debt Inversion: Why AI Makes Pro Code Safer Than Low Code
2026-01-16

The Tech Debt Inversion: Why AI Makes Pro Code Safer Than Low Code

2026-01-11

AI in Government: Beyond the Hype

2024

Understanding User Journeys in the Rentals Market
2024-01-01

Understanding User Journeys in the Rentals Market

Peripheral & bimanual reaching after stroke with left visual neglect
2024-01-01

Peripheral & bimanual reaching after stroke with left visual neglect

2023

Strongest evidence of brain's ability to compensate for cognitive decline
2023-05-01

Strongest evidence of brain's ability to compensate for cognitive decline

Neural evidence of functional compensation for fluid intelligence
2023-01-01

Neural evidence of functional compensation for fluid intelligence

2022

The role of the anterior temporal cortex in action
2022-01-01

The role of the anterior temporal cortex in action

2021

Dedifferentation of motor cortex in healthy ageing
2021-09-27

Dedifferentation of motor cortex in healthy ageing

Holding a tool wrong? This brain region will notice
2021-01-01

Holding a tool wrong? This brain region will notice

Receive AI analytics insights

Connect:

© Ethan Knights. Built with Python & Coffee.